Let’s Talk Markets
A complete analysis of the market to help you understand stocks better. Watch research videos and get other useful insights to be well versed with the latest market trends.
Understanding Stocks
Get acquainted with various Do’s & Don’ts of stock market trading. Read more and understand how you can cautiously use you money to make smart investments.
From the Service Desk
Are you uncertain about trading in a volatile market? Our service desk answers all your doubts regarding share trading and stock markets. Educate yourself on how the market behaves and be more confident with your decisions.
Technical Analysis
Learn how SMA (Simple Moving Averages), Bollinger Bands, Williams %R and various other technical charts can assist you in stock trading. Learn to make effective prediction on the movement of stocks using technical analysis of past-market data.
Management Musings
Learning from the experts - Know the macro views on the markets and the industry as our top leaders analyse and discuss the prevailing trends.
Insights
Get to the core of a company’s financial statements with insights provided by our experts. Read through the fine print of results and analysis to choose the right stock to invest.
Fundamental Analysis
Read all about our research team’s work on the “Fundamentals” of a company. Our analysts’ help you make informed decisions to help you make smart investments and generate better returns.
Others
Understanding Derivatives
uTalk
Share your experiences and opinions with us. Get to know the many fascinating stories of our employees, clients and everyone else who has an opinion.


- There should be an existing trend, which can be reversed and predicted through reversal patterns.
- The existing trendline should be violated or penetrated to indicate the change in trend and reversal of direction of price movements.
- The strength of a reversal pattern may be gauged by the height and width of the reversal pattern. The larger the height and width of the pattern, the stronger is the resultant reversal.
- Formation of patterns in tops and bottoms indicate the possibility of reverse movements. Thus, after completion of topping patterns, prices are expected to come down and after formation of bottoming patterns, prices are expected to rally.
- The volumes indicator may throw light on the strength of reversal patterns especially in case of reversal from bottoming patterns.
This is by far the most powerful reversal pattern and is depicted by a head and two shoulders (left and right). A neckline is drawn connecting the formations of bottoms, from which point prices move upwards to form the head and the right shoulder. The pattern is complete when this neckline is violated and prices are expected to fall further. The scrip price then tries to pull back by forming a new top, still lower than the neckline. It may be depicted by way of the following figure:

This is the mirror image of head and shoulder reversal pattern and may be depicted by way of the following figure. A penetration of the neckline formed by connecting the tops indicates that the price of the scrip may rally and may face a slight reversal, still above the neckline.

This reversal pattern is formed by more than one left and right shoulder. These patterns may again be 'complex' as well as 'complex inverse' patterns as depicted by way of the following two figures:


When head and shoulder reversal patterns, as depicted in earlier figures fail, it is termed as a 'failed head and shoulder' reversal pattern. The formation of this pattern clearly indicates the need for a stop loss order and covering short position, as the price tends to move up again. This can be depicted by way of following figure:

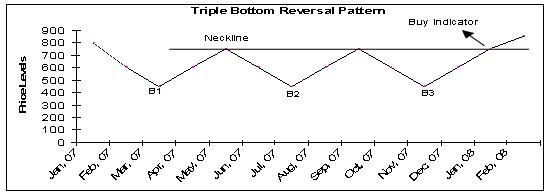
The formation of triple tops and the subsequent reversal of the price below the neckline formed by connecting the bottoms are depicted by a triple top reversal pattern. This is explained by way of the following figure:

This is just the mirror image of the triple top reversal pattern and can be depicted by way of the following figure. Penetration of the neckline indicates an upward movement of the price.
Also called the 'M type' reversal pattern, the Double Top Reversal Pattern price formation rises twice to form two tops with an intervening bottom. The formation of reversal is complete when prices fall below the previous bottom from where price had risen to form the second top. This is an indication that suggests selling. The formation may be depicted by way of the following figure:

The double bottom reversal pattern is a mirror image of the double top reversal pattern. The formation is complete when the price of the scrip penetrates the line drawn by connecting the top in between the two bottoms horizontally to the rising price trend. This may be depicted by way of the following figure:

Also known as a saucer type of reversal pattern, this indicates a steady but gradual shift in the trend from top to bottom followed by a rise back to the top (in case of rounding bottoms) and from bottom to top to bottom again (in case of rounding tops). A graphical representation will be as follows:

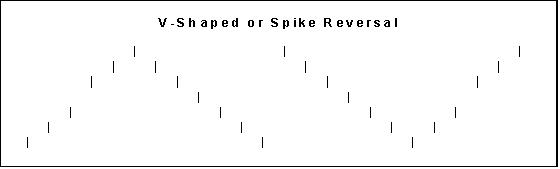
This reversal pattern is recognized by the V formation in the prices of a scrip and can be depicted by way of the following diagram:
A top or bottom broadening patterns may be formed to depict the price levels. In the case of a top broadening pattern, a horizontal line is drawn connecting the almost equal bottoms and rising tops. The formation is complete when the price dips below the horizontal line (in the case of a top pattern) and rallies above the horizontal line in the case of a bottom pattern. A graphical representation of these patterns is as below:


This may again be top horizontal pattern or bottom horizontal pattern and give indication of buy or sell depending upon whether price breaks out above or below the line connecting the tops or bottoms formations. These reversal patterns may be depicted graphically as per the following figures:


0 comments Post Comment


